
There will be no extended analysis of deeper PCS meaning this go-round, but a quick overview of just how tight the race in U.S. and Canadian pairs — for those 3-4-5 spots at home, for international opportunities or top 10 Worlds finishes — looks after the work of last season.
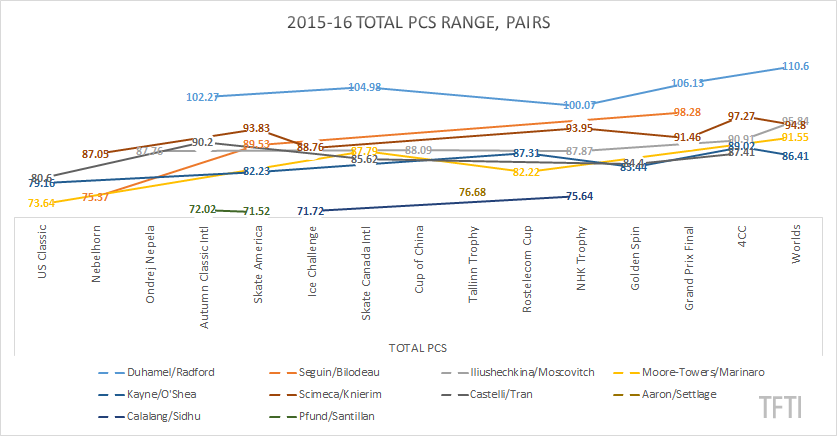
Two-time world champions Meagan Duhamel and Eric Radford are an obvious outlier, while teams like Jessica Calalang and Zack Sidhu or Jessica Pfund and Joshua Santillan are on a more emerging level, and Madeline Aaron and Max Settlage, who had a strong autumn in 2014-15, only competed at one international last season due to injury. But removing these four pairs leaves us still with six whose average total PCS (the combined marks from both short and long program at each event, added together and divided by number of events) is only separated by 8.65 points from highest — 92.45 for Alexa [then] Scimeca and Chris Knierim — to lowest, Kirsten Moore-Towers and Michael Marinaro’s 83.8.
Even given the overall average of all non-Duhamel/Radford teams (85.7), the range of deviations from that par are relatively narrow. Though it’s a -12.02 and -13.93 difference for Calalang/Sidhu and Pfund/Santillan, Scimeca/Knierim have only a +6.75 edge, and the range lessens from there; Marissa Castelli and Mervin Tran, a sort of median team on this chart, have an average PCS total of 85.65. And given a general upward PCS trend for those teams with multiple international opportunities — particularly those competing at the Grand Prix Final, 4CC and/or Worlds — it’s possible the gap could have narrowed for a Calalang/Sidhu or Pfund/Santillan with a third, later event, even at Challenger level.
Technical execution, or level of base difficulty, can’t be entirely ignored, but entering the 2016-17 season, these pairs are also fairly well-matched against each other overall, with only Scimeca/Knierim (who also possess the benefits of tenure as a pair) delivering a uniquely high-level element, the quad twist, to bolster scoring potential. It also remains to be seen what impact the re-introduction of Haven Denney and Brandon Frazier will have on the U.S. scene in particular, with high marks in their choreographically-intricate Skate Detroit long program — despite singled axels — suggesting the possibilities of regaining their 2014-15 position after missing last season due to injury.
But as 2016-17 encroaches, here’s an overview of component qualities — as they stood before this off-season’s minor revisions — for these closely-ranking U.S. and Canadian duos.1
As a caveat, individual PCS marks are naturally higher in a long program than short, with judges’ marks as of 2015-16 multiplied by a factor of 1.6 in the LP versus 0.8 in the SP. With that in mind, I’ve added the individual component marks from short and long program at each event, and subsequently averaged those marks. Note that on average, no team excels most strongly in Transitions or Performance/Execution — but the actual set of highest marks tells a slightly different tale.
| Team | SS (Avg) | TR (Avg) | PE (Avg) | CH (Avg) | IN (Avg) | Actual Best |
|---|---|---|---|---|---|---|
| Julianne Seguin / Charlie Bilodeau | 14.54 | 14.38 | 14.68 | 14.7 | 14.77 | PE, IN | 16.5 (Grand Prix Final) |
| Lubov Iliushechkina / Dylan Moscovitch | 15.03 | 14.71 | 14.88 | 15.15 | 15.03 | PE | 16.00 (Worlds) |
| Kirsten Moore-Towers / Michael Marinaro | 13.96 | 13.72 | 14.1 | 14.15 | 14.03 | PE | 15.54 (Worlds) |
| Tarah Kayne / Danny O’Shea | 13.98 | 13.68 | 14.02 | 14.12 | 14.23 | IN | 15.03 (Four Continents) |
| Alexa Scimeca / Chris Knierim | 15.6 | 15.01 | 15.35 | 15.57 | 15.4 | SS | 16.29 (Worlds) |
| Marissa Castelli / Mervin Tran | 14.25 | 14.1 | 14.12 | 14.35 | 14.26 | CH | 15.34 (Autumn Classic International) |
Interestingly, Skating Skills are also a strength for two of the teams not included in this table: Calalang/Sidhu (13.04 at NHK Trophy as their best actual total, with an average Choreography total of 12.7 their best average) and Pfund/Santillan (both their average best at 12.23 and actual best with a 12.28 in the category at Skate America). Though a smaller sample size of only two events each limits full assessment of these pairs, it’s notable given how seldom SS appears as even a second-best category for most other teams in this analysis.
Individual category marks by event, of course, show a great deal more variety; Performance/Execution can suffer mightily due to a poor technical outing, while Choreography/Composition or Interpretation might in their way benefit from a strong demonstration of material. What is at least apparent is that experience is an advantage, and we’ll see how the many shorter-lived teams might come out this season after an additional year to develop team unity — and to gain exposure before an international judging panel.