
by Jacquelyn Thayer
Range among PCS categories — and among marks assigned by individual judges within a category — may be the nitpickiest of topics to assess. Certainly numbers here are minuscule, with variations typically hovering around the 1-point range for both dance teams and pairs (despite the different factor applied to each category within dance): even a low- or high-marking judge will only fall so far out of step with the mass remaining, and only so much range seems to be perceived between a team’s ability in, for example, Skating Skills versus Choreography. But in the International Judging System, even tenths and ones can sometimes suggest greater meaning.
There is something deceptive in a direct comparison between a team’s high and low mark in a given PCS category, as, indeed, highs and lows are removed from consideration. But highs and lows are not created equally, and in dance, a narrow gap seems roughly correlated with experience at the senior level and World Championship stage; four of the five teams with the narrowest average range skated as international seniors for at least 8 years and up to 12, while fifth team Elena Ilinykh & Nikita Katsalapov became the 2014 Olympic bronze medalists. Teams seeing a wider range of marks tended in general to have a lower international profile or less mutual experience at Worlds, though this does not apparently coincide with any trends in placement. Of some particular note as well is the span across ranges; while the average range is 1.16, 0.1 is about the greatest progression between each team average, with one prominent exception between the cases of the top two teams. While Tessa Virtue & Scott Moir’s range of 0.6 is quite narrow on average, Meryl Davis & Charlie White’s span of 0.275 is extraordinarily so.
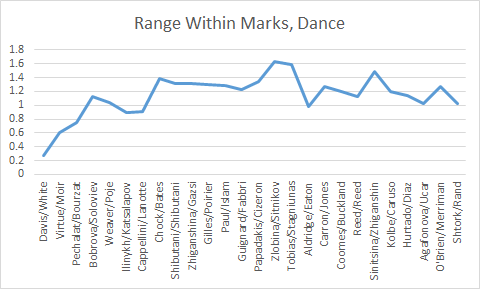
Lowest average range between marks assigned by individual judges, Olympics and/or Worlds = 0.275, Davis/White
Highest average range between marks assigned by individual judges, Olympics and/or Worlds = 1.638, Zlobina/Sitnikov
1. 0.275 (Davis/White)
2. 0.6 (Virtue/Moir)
3. 0.75 (Pechalat/Bourzat)
4. 0.9 (Ilinykh/Katsalapov)
5. 0.913 (Cappellini/Lanotte)
21. 1.35 (Papadakis/Cizeron)
22. 1.388 (Chock/Bates)
23. 1.488 (Sinitsina/Zhiganshin)
24. 1.588 (Tobias/Stagniunas)
25. 1.638 (Zlobina/Sitnikov)
Category with greatest range on average:
Short Dance: Interpretation/Timing, 1.31
Free Dance: Transitions, 1.335
Pairs sees a similar case of experience correlating with narrow range across individual marks, though the overall range is narrower: Olympic champions Tatiana Volosozhar & Maxim Trankov saw an average discrepancy of 0.6 across judges’ scores per category. But in a curious trend not seen as significantly in dance, the majority of pairs who competed in both Sochi and Saitama saw the average range actually increase at the second event, suggesting that familiarity on the largest international stage may not be a significant factor in prompting consensus within a judging panel.
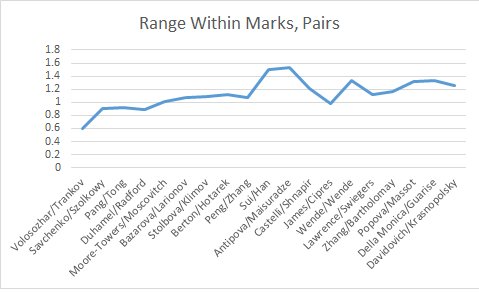
Lowest average range between marks assigned by individual judges, Olympics and/or Worlds = 0.6, Volosozhar/Trankov
Highest average range between marks assigned by individual judges, Olympics and/or Worlds = 1.525, Antipova/Maisuradze
1. 0.6 (Volosozhar/Trankov)
2. 0.8875 (Duhamel/Radford)
3. 0.9 (Savchenko/Szolkowy)
4. 0.925 (Pang/Tong)
5. 0.975 (James/Cipres)
21. 1.25 (Davidovich/Krasnopolski)
22. 1.325 (Popova/Massot)
23. 1.3375 (Wende/Wende and Della Monica/Guarise)
24. 1.5 (Sui/Han)
25. 1.525 (Antipova/Maisuradze)
Category with greatest range on average:
Short Program: Interpretation/Timing, 1.34
Long Program: Choreography, 1.02
Where greater diversity should be apparent — should, of course, being a key word — is in a cross-comparison of PCS marks for a given team. The abilities of top and bottom teams might be expected to fall within a fairly close range, with Skating Skills and Transitions alike demonstrating a fairly equivalent level of accomplishment. But even as all PCS categories are essentially rooted within assessing different aspects of a team’s skating ability, many teams, perhaps the majority, might seem to excel more in some regards than in others: a team might skate sublimely but fail to demonstrate transitions or musical interpretation of an equal level, or present challenging choreography while struggling to master all of its edgework or close hold.
In the Olympic pairs event, a sort of reverse bell curve forms with the highest- and lowest-ranking teams tending to see the greatest average range across categories — both Volosozhar & Trankov and Nicole Della Monica & Matteo Guarise saw a 0.5 range, as did an additional select few at top or near bottom — while seventh-place finisher Meagan Duhamel & Eric Radford’s 0.145 was by far the narrowest cross-category gap. But given a shift in placements at Worlds along with the absence of two top pairs, those patterns held less true in Japan, though ranges otherwise changed minimally per team. Sochi bronze medalists and long-tenured veterans Aliona Savchenko & Robin Szolkowy’s Olympic range of 0.465 was followed in their Worlds victory with a range of 0.48, but a next-highest range of 0.465 belonged to the 5th, 10th, 12th and 15th place finishers; a general up-and-down pattern is true from placement to placement.
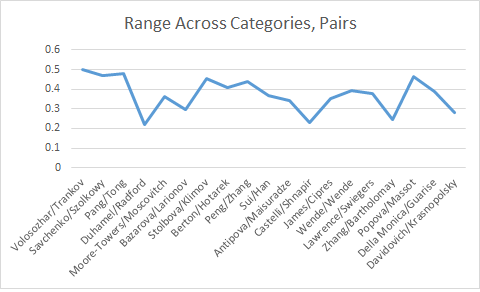
Average range across categories, Olympics
1. 0.145 (Duhamel/Radford)
2. 0.21 (Castelli/Shnapir)
3. 0.23 (James/Cipres)
4. 0.27 (Zhang/Bartholomay)
5. 0.28 (Davidovich/Krasnopolski)
12. 0.445 (Della Monica/Guarise)
13. 0.465 (Savchenko/Szolkowy)
14. 0.48 (Pang/Tong)
15. 0.5 (Volosozhar/Trankov)
16. 0.515 (Stolbova/Klimov)
Average range across categories, Worlds
1. 0.195 (Bazarova/Larionov)
2. 0.22 (Zhang/Bartholomay)
3. 0.25 (Castelli/Shnapir)
4. 0.29 (Duhamel/Radford)
5. 0.335 (Della Monica/Guarise)
12. 0.37 (Sui/Han)
13. 0.395 (Stolbova/Klimov and Wende/Wende)
14. 0.41 (Berton/Hotarek)
15. 0.465 (Peng/Zhang, James/Cipres, Lawrence/Swiegers, and Popova/Massot)
16. 0.48 (Savchenko/Szolkowy)
Range between highest and lowest PCS category totals, Olympics SP (avg range = 0.36):
0.11 (Duhamel/Radford) and 0.57 (Pang/Tong)
Range between highest and lowest PCS category, Olympics LP (avg range = 0.37):
0.17 (Castelli/Shnapir) and 0.53 (Stolbova/Klimov)
Range between highest and lowest PCS category, Worlds SP (avg range = 0.36):
0.11 (Bazarova/Larionov) and 0.54 (Savchenko/Szolkowy)
Range between highest and lowest PCS category, Worlds LP (avg range = 0.38):
0.22 (Zhang/Bartholomay) and 0.5 (Peng/Zhang, James/Cipres and Popova/Massot)
Similarly, no obvious pattern emerges within dance at either the Olympic or World event; an average range of 0.325 for Davis & White is shared by Madison Chock & Evan Bates; a low of 0.285 for Julia Zlobina & Alexei Sitnikov and high of 0.505 for Nelli Zhiganshina & Alexander Gazsi are interesting, but minimally revealing when placed in context with other nearly as varied results. Between the Olympics and Worlds, however, one fact that does emerge is the broadening of range from one event to the next: a span of 0.4 in Sochi grew to 0.44 in Saitama, with the range for World champions Anna Cappellini & Luca Lanotte moving from 0.375 to 0.485, for example, and that of silver medalists Kaitlyn Weaver & Anrew Poje growing from a very narrow 0.29 to slightly greater 0.36. For many middle-placing teams, like Zhiganshina & Gazsi or Sara Hurtado & Adria Diaz, ranges stayed more comparable, while Chock & Bates actually saw identical 0.35 average gaps at each competition. At Worlds, the most established team of Nathalie Pechalat & Fabian Bourzat did see the closest cross-category range — 0.325 — but Turkey’s young and low-ranking Alisa Agafonova & Alper Ucar saw an identical range to Cappellini & Lanotte, and, as in pairs, numbers are generally mixed across placements.
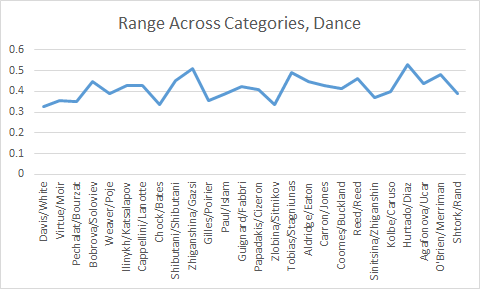
Average range across categories, Olympics
1. 0.285 (Zlobina/Sitnikov)
2. 0.325 (D/W, Chock/Bates)
3. 0.34 (Sinitsina/Zhiganshin, Paul/Islam)
4. 0.345 (Guignard/Fabbri)
5. 0.355 (Virtue/Moir)
16. 0.445 (Weaver/Poje)
17. 0.45 (Bobrova/Soloviev)
18. 0.465 (Tobias/Stagniunas)
19. 0.48 (O’Brien/Merriman)
20. 0.505 (Zhiganshina/Gazsi)
Average range across categories, Worlds
1. 0.325 (Pechalat/Bourzat)
2. 0.35 (Chock/Bates)
3. 0.355 (Gilles/Poirier)
4. 0.36 (Weaver/Poje)
5. 0.385 (Zlobina/Sitnikov)
16. 0.485 (Cappellini/Lanotte and Agafonova/Ucar)
17. 0.505 (Guignard/Fabbri)
18. 0.515 (Zhiganshina/Gazsi and Tobias/Stagniunas)
19. 0.52 (Shibutani/Shibutani)
20. 0.625 (Hurtado/Diaz)
Range between highest and lowest PCS category totals, Olympics SD (avg range = 0.39):
0.18 (Zlobina/Sitnikov) and 0.54 (Bobrova/Soloviev)
Range between highest and lowest PCS category, Olympics FD (avg range = 0.4):
0.25 (Sinitsina/Zhiganshin) and 0.5 (Weaver/Poje, Carron/Jones, Tobias/Stagniunas and O’Brien/Merriman)
Range between highest and lowest PCS category, Worlds SD (avg range = 0.4):
0.25 (Pechalat/Bourzat) and 0.64 (Hurtado/Diaz)
Range between highest and lowest PCS category, Worlds FD (avg range = 0.49):
0.35 (Chock/Bates) and 0.64 (Tobias/Stagniunas)
General trends here do suggest that the better-known, or better-regarded the team, the greater the consensus among individual judges, though no such pattern seems to emerge when categories themselves are compared for a team. But this may, overall, be one case in which close and narrow examination speaks more loudly than a larger scale evaluation. A team with polarizing material may, in fact, very much be a team whose choreography range or total falls far out of line with the remaining PCS; another pair may see a significantly growing consensus after just one major success. The spreadsheets, then, are there for the perusing.
In our next entry, we’ll take a look at PCS in a more historical context.