
by Jacquelyn Thayer
In the wake of the 2017 World Championships, an expanded look at the numbers beneath the outcomes.
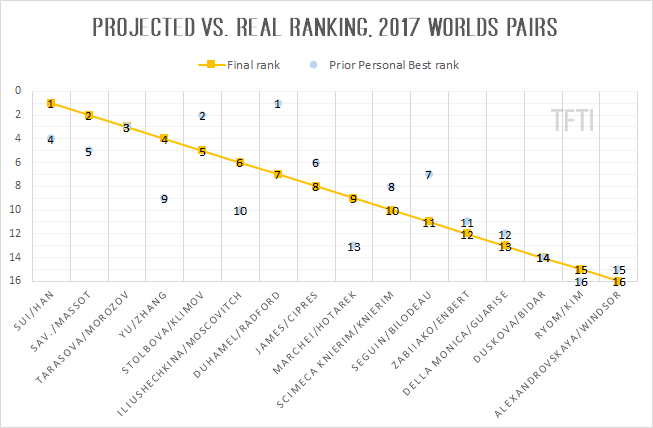
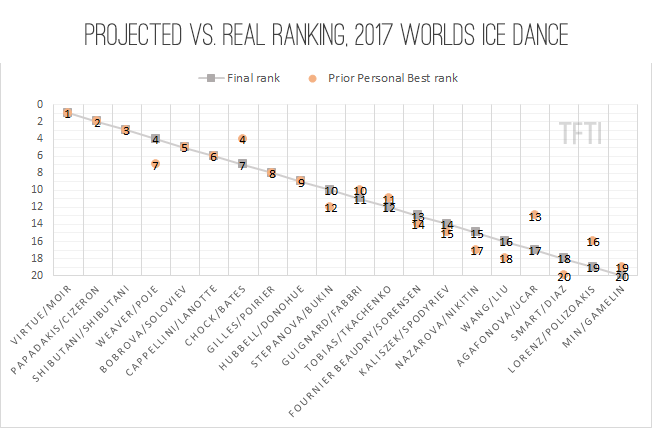
Of course, it also makes more notable those very specific cases of “ranking” continuity — usually among the very top and very bottom, but also quite interesting as compared across disciplines:
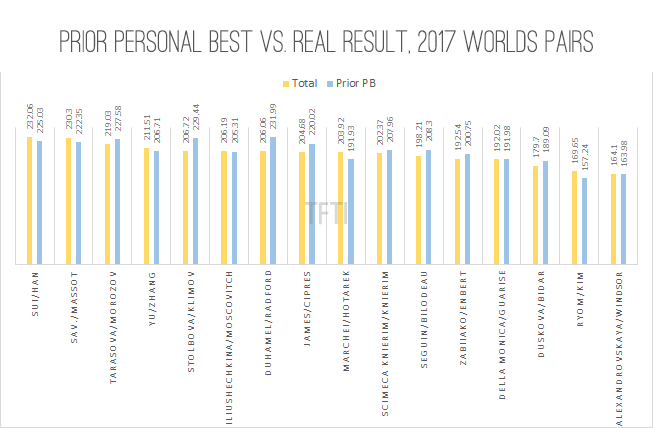
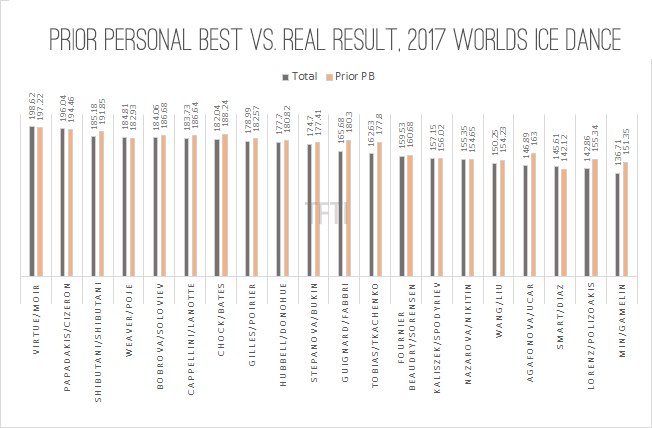
For many teams, percent change from their original ISU personal best (PB) to the score racked up here is too insignificant to note. However, 14/20 dance teams and 8/16 pairs scored below their personal ceilings (of those in dance whose scores grew, only Olivia Smart and Adrià Diaz at a 2.46% increase broke past the 1% or less threshold), and a few extreme swings are worth noting:
Dance (Challenger events highlighted in violet)
Charlene Guignard/Marco Fabbri = -8.10% (PB 180.3 obtained at 2016 Golden Spin of Zagreb)
Isabella Tobias/Ilia Tkachenko = -8.53% (PB 177.8 obtained at 2016 Tallinn Trophy)
Yura Min/Alexander Gamelin = -9.67% (PB 151.35 obtained at 2016 Tallinn Trophy)
Alisa Agafonova/Alper Uçar = -9.88% (PB 163 obtained at 2016 Tallinn Trophy)
Pairs
Tae Ok Ryon/Ju Sik Kim = +7.89%
Ksenia Stolbova/Fedor Klimov = -9.90% (PB 223.44 obtained at 2015 Grand Prix Final)
Megan Duhamel/Eric Radford = -11.18% (PB 231.99 obtained at 2016 World Championships)
And a couple of scoring swings came down to a fraction of point — see Ekaterina Alexandrovskaya and Harley Windsor’s 0.07% increase and Nicole Della Monica and Matteo Guarise’s even narrower 0.02%.
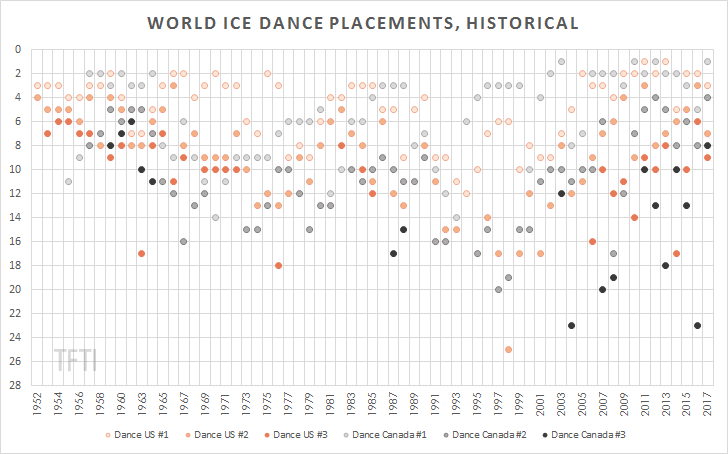
Be wary, however, of thinking those high placements of early years meant North American couples came out swinging. Only in 1967 did a pairs roster first exceed 15 teams — not even reaching 20 until 1992 — while the more popular dance still didn’t host 20 entries until 1971, taking another decade to exceed that number by one. Neither discipline instituted a free program cut-off until 1976 (10 couples apiece); such a cut-off would re-emerge in the late 1980s, with occasional adjustments by year but, generally, a max 24 couples permitted to compete in the pairs free (down to 20 by 1999) and 24 in the free dance. Those cut-off numbers formally shrank to their current 16 and 20 in 2010, though the total number of entries is among the largest it’s ever been.

Finally, then, how did Team North America’s podium percentage change after this year’s events? For the better for the dancers, but not so well for the pairs: